IS-IS watcher. Tracking IS-IS topology changes in Real-Time#
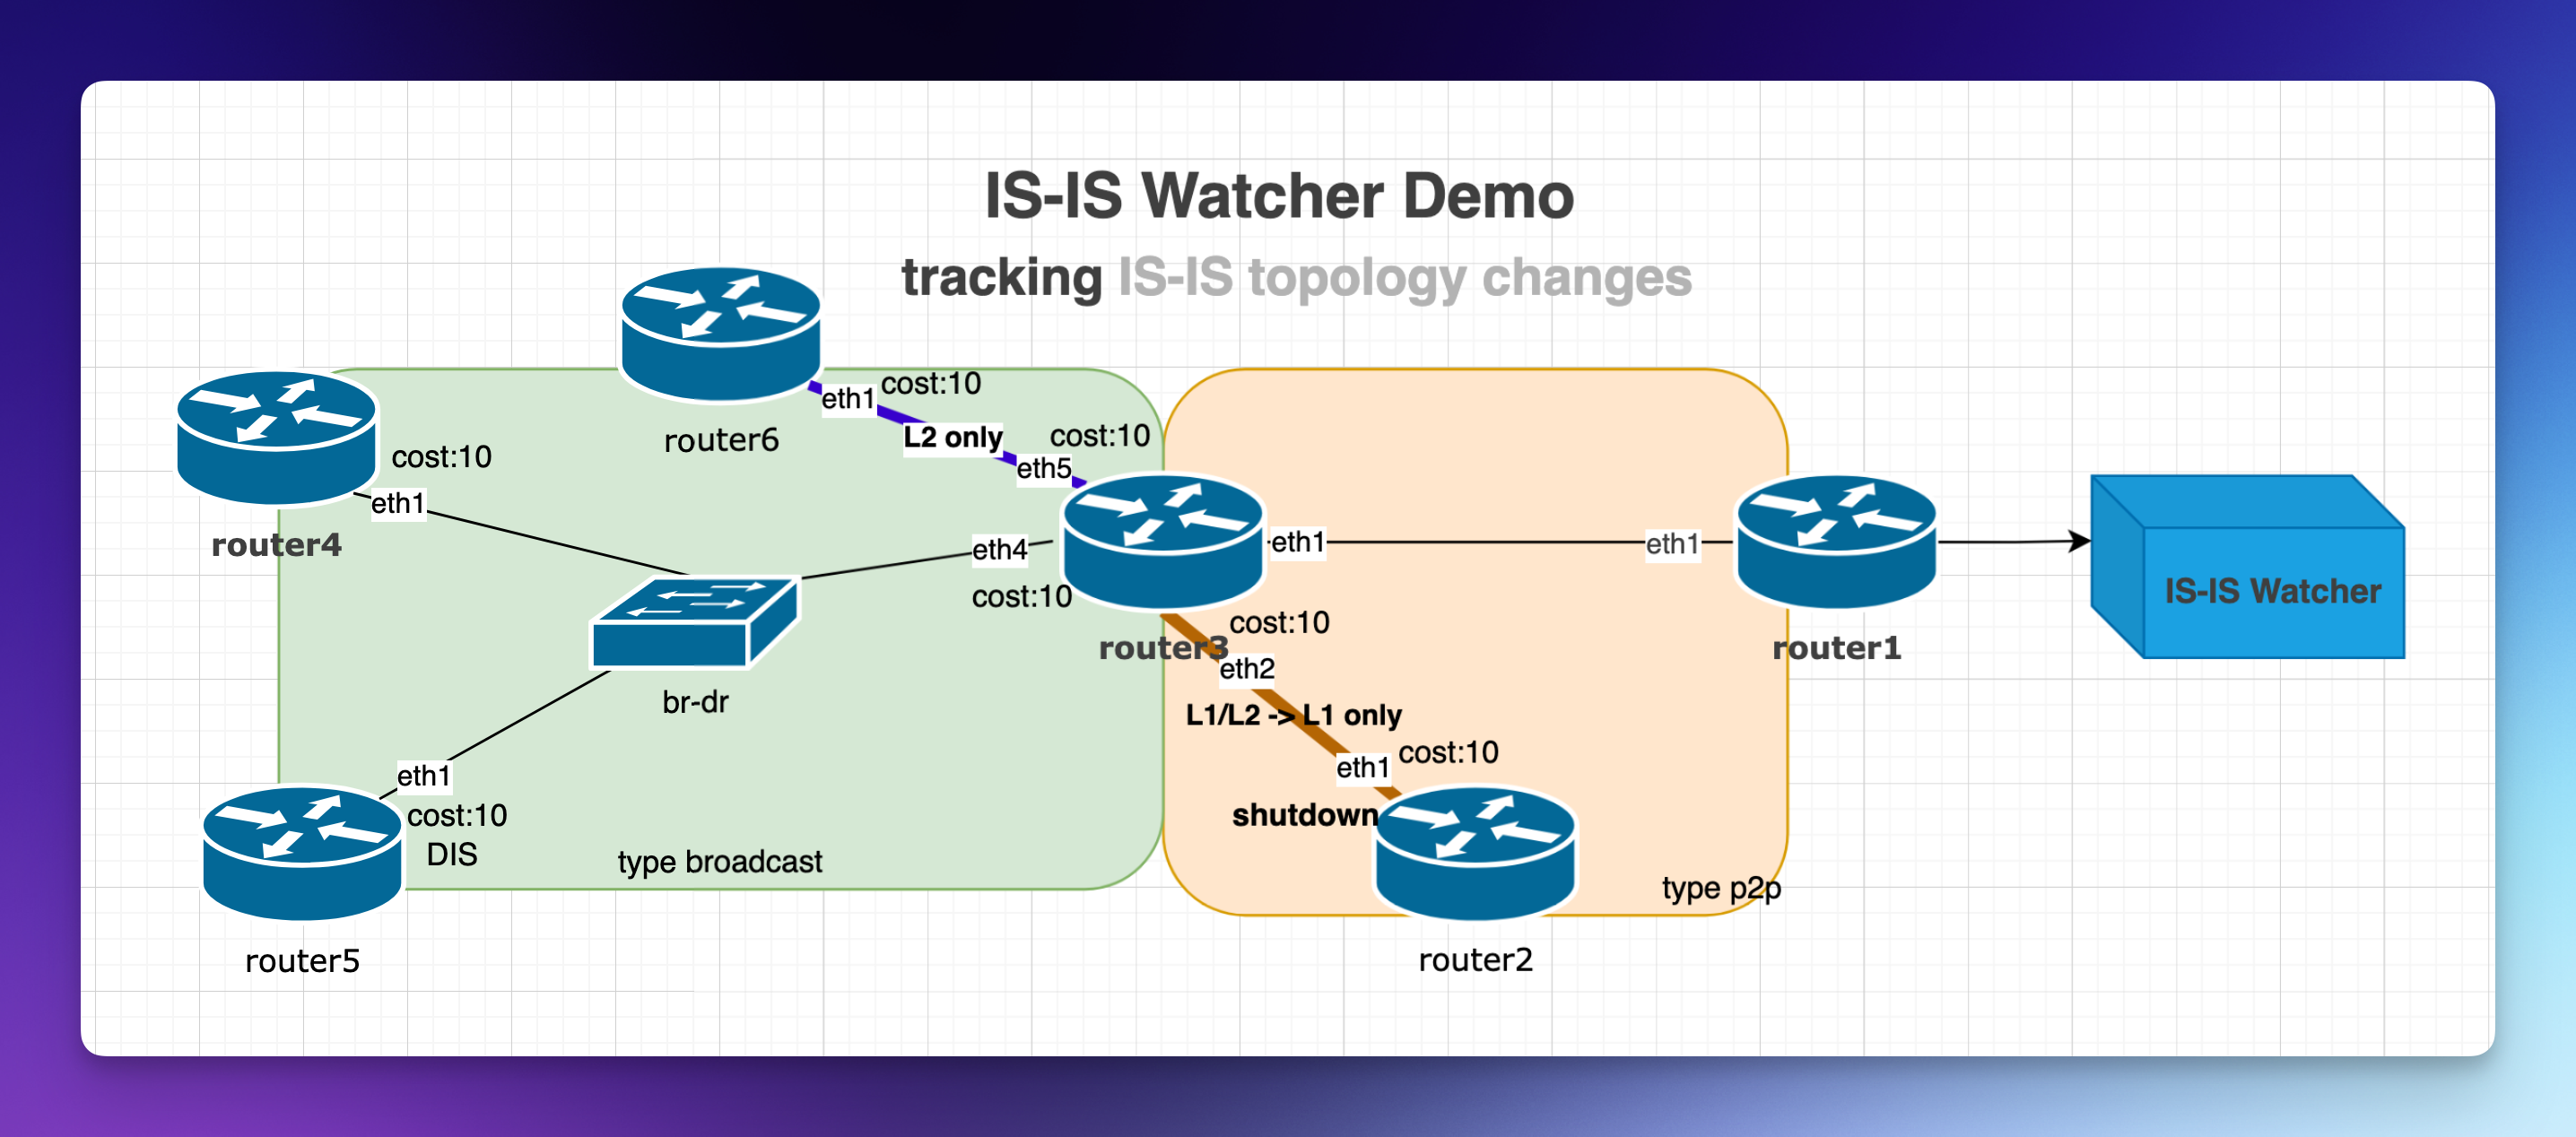
This lab consists of 6 FRR routers and a single IS-IS Watcher. Each router is pre-configured to be part of an IS-IS domain with different network types. Any topology changes detected by the IS-IS Watcher are logged in the file watcher/watcher.log. The logging capabilities can be enhanced with tools like ELK or Topolograph, enabling features such as searching changes by time and exporting data to message brokers, Zabbix, and more. For further details, refer to the Links page.
IS-IS Topology Watcher#
IS-IS Watcher is a monitoring tool of IS-IS topology changes for network engineers. It works via passively listening to IS-IS control plane messages through a specially established IS-IS adjacency between IS-IS Watcher and one of the network device. It assists in analyzing incidents by determining the precise time and location of events, as well as their distribution across the network in a retrospective manner.
Detected network events#
- IS-IS neighbor adjacency Up/Down
- IS-IS link cost changes
- IS-IS networks appearance/disappearance from the topology
- IS-IS TE attributes:
- Administrative Group (color, resource class)
- Maximum Link Bandwidth
- Maximum Reservable Link Bandwidth
- Unreserved Bandwidth
- Traffic Engineering Default Metric
Supported IS-IS TLV#
| TLV name | TLV | subTLV |
|---|---|---|
| IS Reachability | 2 | |
| Extended IS Reachability (new) | 22 | 3,6,8,9,10,11,12,13,18 |
| IPv4 Internal Reachability (old) | 128 | |
| IPv4 External Reachability (old) | 130 | |
| Extended IPv4 Reachability (new) | 135 | |
| IPv6 Reachability | 236 |
Quickstart#
- Install containerlab.
-
Run the script to prepare environment:
./prepare.sh -
Start the lab
sudo clab deploy --topo frr01.clab.yml -
Check that Watcher is ready (usually it requires 10-15sec to be ready). Proceed to the next step once Watcher is ready.
sudo docker logs clab-frr01-isis-watcherExpected output:
lsdb_output:Area lab: IS-IS Level-1 link-state database: LSP ID PduLen SeqNumber Chksum Holdtime ATT/P/OL 0100.1001.0001.00-00 * 222 0x00000002 0x9611 1144 1/0/0 Protocols Supp ISIS LSDB has been received Sniffing packets on interface: eth1 -
Start watching logs
sudo tail -f watcher/watcher.log -
Change IS-IS settings on lab' routers. Connect to a router in another terminal
sudo docker exec -it clab-frr01-router6 vtyshChange metric on the interface
router6# conf t
router6(config)# int eth1
router6(config-if)# isis metric 66
Add new stub network
router6(config-if)# ip address 10.10.36.6/24Remove another one
router6(config-if)# no ip address 3ffe::192:168:36:6/127Change unreserve bandwidth TE attribute on a link
router6(config-if)# link-params
router6(config-link-params)# unrsv-bw 1 9+06
assign
admin groupon a linkrouter6(config-link-params)# admin-grp 0xaaShutdown adjancency
router6(config-if)# shutdown
IS-IS Watcher logs location#
Available under watcher folder. To see them:
sudo tail -f watcher/watcher.log
Logs sample 1#
2023-01-01T00:00:00Z,demo-watcher,1,host,0200.1001.0002,down,0200.1001.0003,01Jan2023_00h00m00s_7_hosts,49.0002,12345
2023-01-01T00:00:00Z- event timestampdemo-watcher- name of watcher1- IS-IS levelhost- event name:host,network,metric,temetric0200.1001.0002- event object. Watcher detected an event related to0200.1001.0002hostdown- event status:down,up,changed0200.1001.0003- event detected by this node.01Jan2023_00h00m00s_7_hosts- name of graph in Topolograph dashboard49.0002- area number12345- AS number10.1.23.3- Local IP address of detected node0200.1001.0003(available in 2.0.15)10.1.23.2- Remote IP address relative to the detected node0200.1001.0003(available in 2.0.16) Summary:0200.1001.0003on the interface with10.1.23.3IP address detected that0200.1001.0002host went down at2023-01-01T00:00:00Zin IS-IS level 1 in area 49.0002 in AS 12345
Logs sample 2#
2023-01-01T00:00:00Z,isis-watcher,2,metric,4ffe::192:168:23:2/127,changed,old_cost:10,new_cost:12,0200.1001.0002,stub,0200.1001.0002,01Jan2023_00h00m00s_7_hosts,49.0002,12345,external,1
2023-01-01T00:00:00Z- event timestampisis-watcher- name of watcher2- IS-IS levelmetric- event name:host,network,metric,temetric4ffe::192:168:23:2/127- event object. Watcher detected an event related to 4ffe::192:168:23:2/127` subnetchanged- event status:down,up,changed10- old cost12- new cost0200.1001.0002- event detected by this node.stub- subnet type0200.1001.0002- since it's a stub network it has router id of terminated node.01Jan2023_00h00m00s_7_hosts- name of graph in Topolograph dashboard49.0002- area number12345- AS numberexternal- subnet type internal|external1- subnet ext type 1|2. 0 for internal subnets Summary:0200.1001.0002detected that metric of4ffe::192:168:23:2/127stub network changed from10to12at2023-01-01T00:00:00Zin IS-IS level 2
Logs sample 3. TE#
2024-12-29T13:20:50.398Z,
isis-watcher,1,temetric,0200.1001.0002,changed,0_17_19_20_21_22_26_29_30,1000000000,1000000000,1000000008_1000000016_1000000024_1000000032_1000000040_1000000048_1000000056,11223344,0200.1001.0003,2024-07-28T18:03:05Z,49.0001,01Jan2023_00h00m00s_7_hosts,10.1.23.3,10.1.23.2
2023-01-01T00:00:00Z- event timestampdemo-watcher- name of watcher1- IS-IS leveltemetric- event name:host,network,metric,temetric0200.1001.0002- event object. Watcher detected an event related to0200.1001.0002hostchanged- event status:down,up,changed0_17_19_20_21_22_26_29_30- 0, 17, 19, 20, 21, 22, 26, 29, 30 admin groups1000000000- Maximum Link Bandwidth (Sub-TLV 9) bits per sec1000000000- Maximum Reservable Link Bandwidth (Sub-TLV 10) bits per sec1000000008_1000000016_1000000024_1000000032_1000000040_1000000048_1000000056- Unreserved Bandwidth (Sub-TLV 11) for priority 0,..7 bits per sec11223344- Traffic Engineering Default Metric (Sub-TLV 18)0200.1001.0003- event detected by this node.01Jan2023_00h00m00s_7_hosts- name of graph in Topolograph dashboard49.0002- area number12345- AS number10.1.23.3- Local IP address of detected node0200.1001.0003(available in 2.0.15)10.1.23.2- Remote IP address relative to the detected node0200.1001.0003(available in 2.0.16)
Note log file should have
systemd-network:systemd-journalownership
Links#
- IS-IS Watcher - IS-IS topology tracker